

 info@presentationdesigners.co.uk
How To Create A Timeline In Powerpoint
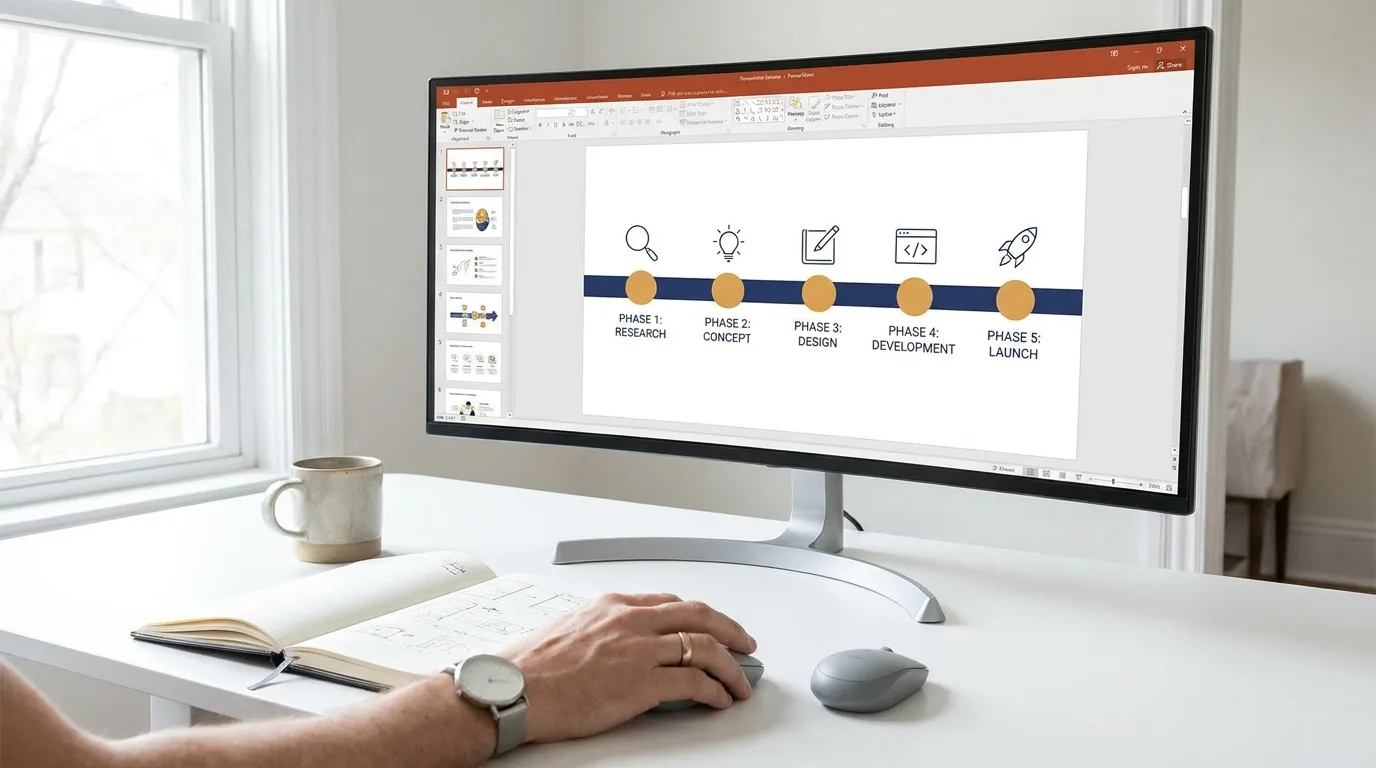
PowerPoint timeline creation does not have to be a difficult task. Discover some practical guidance on how to create a timeline in PowerPoint along with some ideas about layouts and formatting.
A well-planned visual schedule has the potential to turn lengthy, complicated project lists into interesting slides that instantly get the audience’s attention. It is not easy to communicate complicated information concerning milestones and dates without boring the audience.
A bit of structuring knowledge can go a long way in creating slides that can easily map events without any confusion. With good structural skills, complex history lessons and projects are delivered effectively and attractively.
Understanding the power of simple presentation tools will help anyone come up with attractive presentations that will enable them to present their business ideas perfectly.
Knowing how to create a timeline in PowerPoint will give any speaker enough confidence to communicate their large-scale project plans efficiently.
Build Quick Layouts Via Built-In SmartArt Graphics
Select Insert from the ribbon at the top, go to SmartArt, and then click Process to get an immediate visual structure. Add your project dates and events right into the text pane to have the graphic layout generated automatically.
The SmartArt shapes always adapt to size and spacing changes when you add or delete key dates, ensuring the updating process is easy. Collaborating with a leading presentation agency will allow you to improve the design, enhance its flow, and create high-quality custom slides that will engage the viewers.
Apply custom fills and lines using the Design tab to easily match your company’s brand colors. The SmartArt graphics provide you with a quick and fail-safe way of creating visual schedules without any complicated drawing process.
Insert Hand-Drawn Shapes For Complete Design Control
Add a thick horizontal line on the slide by using the Shapes menu to come up with a custom central spine for your timeline. Place some small circles on the main line to indicate the project milestone dates and task completion dates.
Place neat text boxes both above and below the circles to label the important events and date descriptions. For anyone who is trying to learn how to draw timeline in PowerPoint, adding custom shapes provides absolute creativity.
Group all the line segments, circles, and text boxes so that you can move or resize the whole graphic conveniently. Custom shape creation allows one to create unique visual timelines depending on their needs.
Structure Left-To-Right Paths Using Horizontal Arrow Graphics
Select from the Insert tab menu a thick block arrow, and then drag it across the slide to form an arrow. On this arrow, place checkpoints that will be evenly distributed along the arrow to visually demonstrate the sequence of your project.
Dates should be placed along the top of the arrow, while descriptions of each step should go along the bottom. Creating a horizontal timeline in PowerPoint using arrow bases in PowerPoint ensures easy comprehension of long-range project planning right away.
Accurately placing text boxes on a broad arrow base helps to create an automatic flow of reading for the executives. Broad arrow bases help you to transform the lists of dates into easy-to-understand visuals.
Apply Step-By-Step Entrance Animations To Reveal Milestones
Click on every shape corresponding to the milestone and the text box group. Go to the Animations tab on the top ribbon menu. Apply either the Appear or the Fade animation to each item, triggering them on mouse clicks one after another.
Arrange the animation order through the Animation Pane such that the milestones of your project will be displayed in sequence while you make your speech. Discovering innovative corporate presentation design ideas illustrates that a sequence of visual unveilings ensures your audience’s complete concentration.
Preview your slides to ensure that the milestones get introduced on time. Understanding how to create a timeline in PowerPoint using sequential animation makes static date charts into powerful visual aids, complementing your spoken presentation in an excellent way.
Generate Instant Charts Through Dedicated Software Add-Ins
Go to the Insert tab, select Get Add-ins, and find professional milestone generator add-ins from the Office Store. Download the desired add-in to create a project schedule button on your PowerPoint ribbon menu.
Import data from your saved Excel file or use the dates directly in the wizard to get automatic timeline graphics. If you are wondering Is there a timeline add-in for PowerPoint, there are some specialized add-ins that can assist you in creating good visual representations without manually drawing shapes and aligning dates.
These tools help speed up creating the timeline, update your data, and allow you to display your milestones clearly. Using these add-ins will help you create layouts very quickly.
Apply Morph Transitions To Produce Moving Timeline Graphics
Clone your first schedule slide, and shift the middle line and milestone markers to the left in slide number two. Insert new dates related to your project in the future onto the right side of slide two.
Go to the second slide and click on the Transitions tab on the ribbon. Choose the Morph option to add an effect of movement between slides. This technique works very well for students who need help learning how to make a moving timeline in PowerPoint because it adds life to important dates and events without making the presentation too complicated or boring.
Play the slideshow of your presentation, and notice how your dates move smoothly from one slide to another. Knowing how to create a timeline in PowerPoint using Morph transitions makes a great moving effect without creating motion paths or video editing manually.
Highlight Important Stages Using High-Contrast Color Themes
Select the shapes to show your milestones, click on the Format tab, and color each milestone a different color. Use shades of grey for past activities, blue for current activities, and green for completed milestones.
Use your selected accent colors by applying them to matching text headers to create balance in your slide design. When learning how to make a timeline in PowerPoint, the strategic use of colors will help you emphasize significant dates and milestones and lead your audience through each step.
Make sure you have good color contrast between your background and text boxes on the slide. By learning how to create a timeline in PowerPoint with the help of proper color coding, you will be able to transform basic date charts into colorful status reports.
Attach Vector Icons To Visual Milestone Callouts
Select Insert, then Icons, and search for icons that best symbolize your own particular milestones. Put these icons within circles or boxes directly above the date labels on your own main line. Resize and recolor your vector icons with the Graphic Format options to fit in with the color theme of your presentation.
Startup founders working with an investor presentation design service can leverage custom icon callouts to emphasize certain numbers, break down complicated data, and draw attention to key statistics. Such little things in the design can go a long way toward creating compelling slides that catch investors’ eye.
Combine each icon with its corresponding textual explanation to ensure that your visual callouts stay organized as you adjust the layout of your slides. Vector icons add some visual variety to your slides and can change historical text into something more digestible.
Combine Soft Background Layers To Create Visual Depth
Make the big rectangle background for the slide and give it a light grey gradient fill, then place it at the back. The intersection of central lines and milestone shapes on the neutral background box will create a unique hierarchy.
Tweak the transparency settings of your background shapes by using the Format Picture options to make sure your milestone text is visible. Among the various PowerPoint add timeline, consider experimenting with layered backgrounds to create a three-dimensional look and feel that will keep the readers engaged.
Apply light drop shadows to your milestone nodes to give them a sense of depth. Layering simple background shapes allows you to turn regular slide layouts into professional presentation stages.
Draw Curved Freeform Paths To Fit Extended Dates
Choose the Freeform Scribble or Curve tool from the Shapes list and sketch a smooth S-curve on your slide. Go to Edit Points to make any sharp corners smooth and to create an elegant curve on your slide.
Position your milestone markers equidistantly on the curved line, placing text labels alternately above and below the curve. Knowing how to put a timeline in PowerPoint with freeform curves will help you place numerous dates on the same slide.
Modify the line thickness and end cap style in the Format Shape dialog box to make your curve look neat. The curved freeform lines take maximum advantage of slide space and allow you to show long histories of projects on one slide.
Format Clean Typography To Maximize On-Screen Legibility
Select all the text boxes of dates and go to the Home tab and use a sans-serif font like Arial or Helvetica that is bold. Increase font sizes for dates, but keep small font sizes for text descriptions in order to have a good hierarchy of the visual design in the slides.
Use the Paragraph option to space lines out so they have sufficient distance between the text descriptions. Typography is essential when presenting a PPT timeline, as it helps to make the content easy to understand and presents a flawless visual appeal.
Align text boxes to left or center styles in all milestone points. Formatting good typography ensures that all dates in your project will be fully readable by everyone in big room presentations.
Utilize Grid Guides For Precise Element Alignment
By enabling gridlines and guides from the View tab, all markers and text can be aligned accurately. Using alignment guides on the slide will help you align dates and milestone boxes accurately each time.
Proper spacing between milestone nodes results in clean visuals that appear very professional. Knowing how to do a timeline in PowerPoint using alignment guides makes it possible to create a clean design that saves time in the editing process.
Alignment avoids any confusion and ensures that the executives are able to easily view all the information regarding milestones. Excellent grid alignment helps ensure that all your custom presentation slides have a very professional look.
Combine Stacked Milestones To Track Complex Projects
Drawing parallel horizontal lines on one slide lets you monitor several project work streams at once. Understanding how to create a timeline in PowerPoint using color-coded markers in separate lines draws attention to the connection between deliverables of various teams on the same timelines.
Managing the overlapping milestones lets the stakeholders comprehend the interdependencies among different departments without having to navigate through several slides that may be confusing.
Create a project timeline chart in PowerPoint with the help of stacked paths to make it easier for you to monitor parallel activities, draw connections, and visually represent multi-phase projects. This will help keep your project data organized and help you understand how individual tasks contribute to the progress.
Frequently Asked Questions
How can I create a graphical schedule with the help of PowerPoint?
It is quite easy to use the built-in SmartArt graphics. Select a process graphic layout and then enter your dates and milestone names into the text box pane.
How can I depict dynamic progress through presentation slides?
Use motion transition effects such as Morph or entrance animations to show milestones one after another while presenting to viewers on how to create a schedule in PowerPoint.
Can I import my schedule data from Excel spreadsheets?
Yes, you can easily copy data from spreadsheets to SmartArt text panes or use some special slide add-ons. Software does the mapping of your dates and tasks for you automatically.
What’s the ideal format type of project roadmaps?
The best layout is to use a left-to-right horizontal arrangement since this is the natural reading pattern. The horizontal arrangement gives the reader a quick view of the dates of milestones, and plenty of space for detailed descriptions below the milestones.
How many milestone points can I have on one slide?
The ideal number of Milestones for each slide is 4, but at least 7. Limiting the number of entries helps to keep the presentation format simple and easy to understand.
Conclusion
Knowing how to create a timeline in PowerPoint allows turning complicated project dates into a story that audiences will really appreciate.
Using built-in SmartArt graphics, custom shape grouping, and clean horizontal design allows presenters to communicate business milestones with complete clarity.
Adding colors, vector icons, and entrance animations to slides is an effective way to keep audience members focused during presentations.
Whether you import data using add-ins or use custom line paths, proper visual structure will help highlight important dates clearly.